An Interesting Math Phenomena
Hello everyone!
It's been a couple of week since we had an update, but as always we've been hard at work.
Our big focus right now is on improving ease of use and specifically improving the process of finding the anchor point location.
Finding the anchor locations is one of the biggest stumbling blocks for folks getting their machines up and running, and that makes sense. It’s one of the first things that you do after putting the machine together so most people are doing it without any prior experience. It’s also not fun so it’s not something that most folks are excited to do or learn to do.
We’re currently asking the user to do a lot to make this process go smoothly. We are asking for things like what grid size should be used, what should the gird spacing be, is the machine horizontal or vertical, how hard should the belts pull when taking measurements…etc and each of those things is a chance for something to go wrong, or at very least a question that folks who are just getting their machines set up don’t know the answer to (maybe nobody knows the truly optimal answers yet…we’re figuring this all out as we go along).
The thing that we all want is a button that says “Find Anchor Locations” that you can just press and it works 100% of the time in every circumstances. The tricky thing is that this is the is the step where the robot that we control needs to interact with the world that we don’t control or know anything about. It could be on a big frame or a little frame or a vertical frame or a horizontal frame. What we need is for the machine to automatically detect each of those things and make smart choices based on that information.
The first thing one that we are tackling is automatically computing the right values for the size and spacing of the calibration grid. This leads us to a bit of a “which came first, the chicken or the egg?” type problem. To get know how big to make the grid we need to know how big the frame (at least approximately), but figuring out how big the frame is is what we need the grid for.
The solution is that we can take a few (six) measurements and use those to get a rough approximation of big the frame is, and then use that rough approximation to generate the grid. Sort of boot strap our way into understanding the world around the robot.
Unfortunately as soon as we started investigating this idea, we found that our rough approximation from six measurements wasn’t really good enough. Sometimes it would be good enough, and sometimes it would be way off.
We need a solution that works every time, so we started looking into the problem of “how do we quickly and consistently find a good estimate of the anchor locations”.
The tricky thing about finding the anchor points is that it’s a problem in a six dimensional space.
We have five variables that we can adjust. The bottom left anchor point is declared to be (0,0) and the bottom right anchor point is at y=0. Those are freebies because we get to define the coordinate system.
That leaves us with top left x,y top right x,y and bottom right y to adjust which is five variables. We then also have the fitness for each possible combination of points which is a sixth variable.
I’ve been struggling with how to visualize that space because we humans can’t really visualize six dimensional space super well.
Today I had an insight. Our frames are mostly roughly rectangular.
What if instead of trying to visualize something in 6 dimensional space, instead we pretend that the frame is rectangular. That gives us a 3D space to explore (width, height, fitness).
It’s not exactly right, but it does help to explore the space.
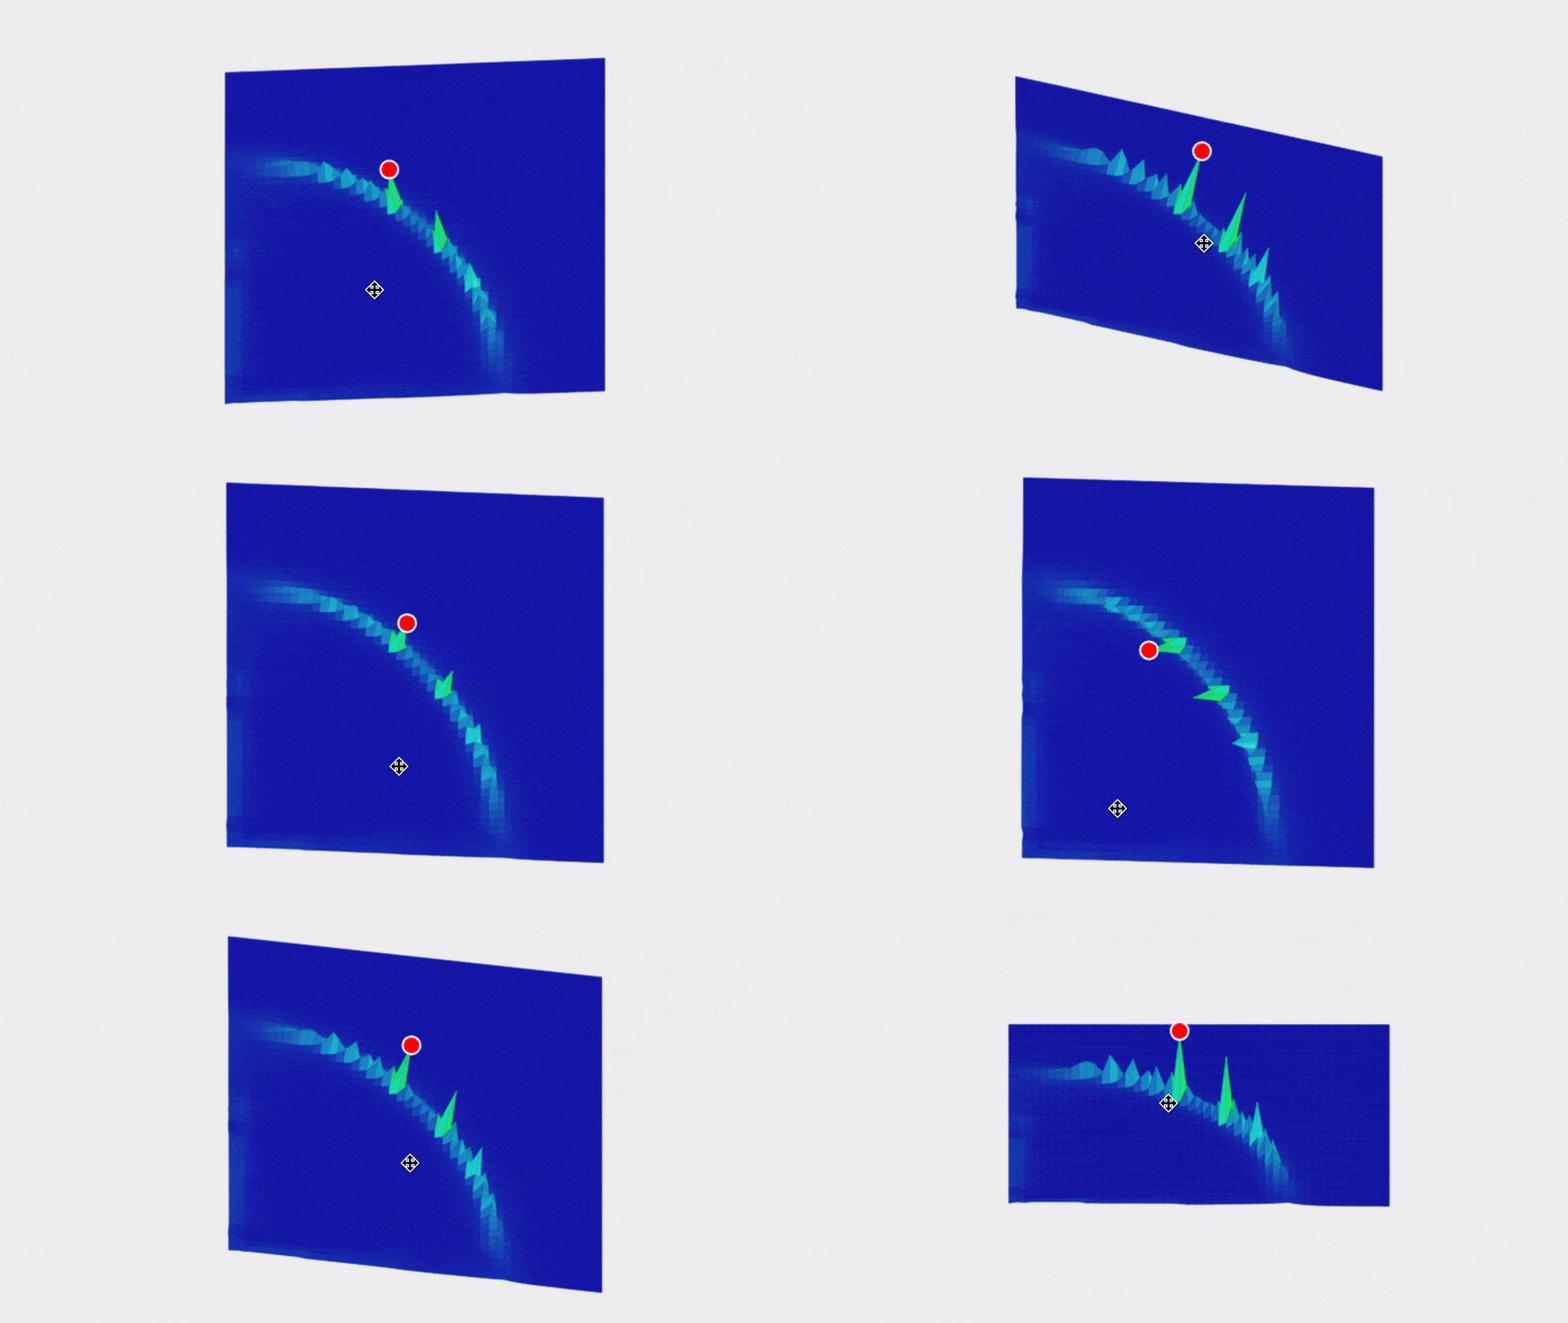
Here are the results and they are quite interesting.
Note that this is not a graph of the machine itself. What we are looking at is possible frame widths on the X axis and possible frame heights on the Y axis and the fitness score for how well that frame size matches our data is in the Z-axis. For example the bottom left tile is for a frame of size 100x100mm in size, the tile one to the right from that is for a frame of 200mmx100mm…the top right tile is for a frame that is 5,000x5,000mm.
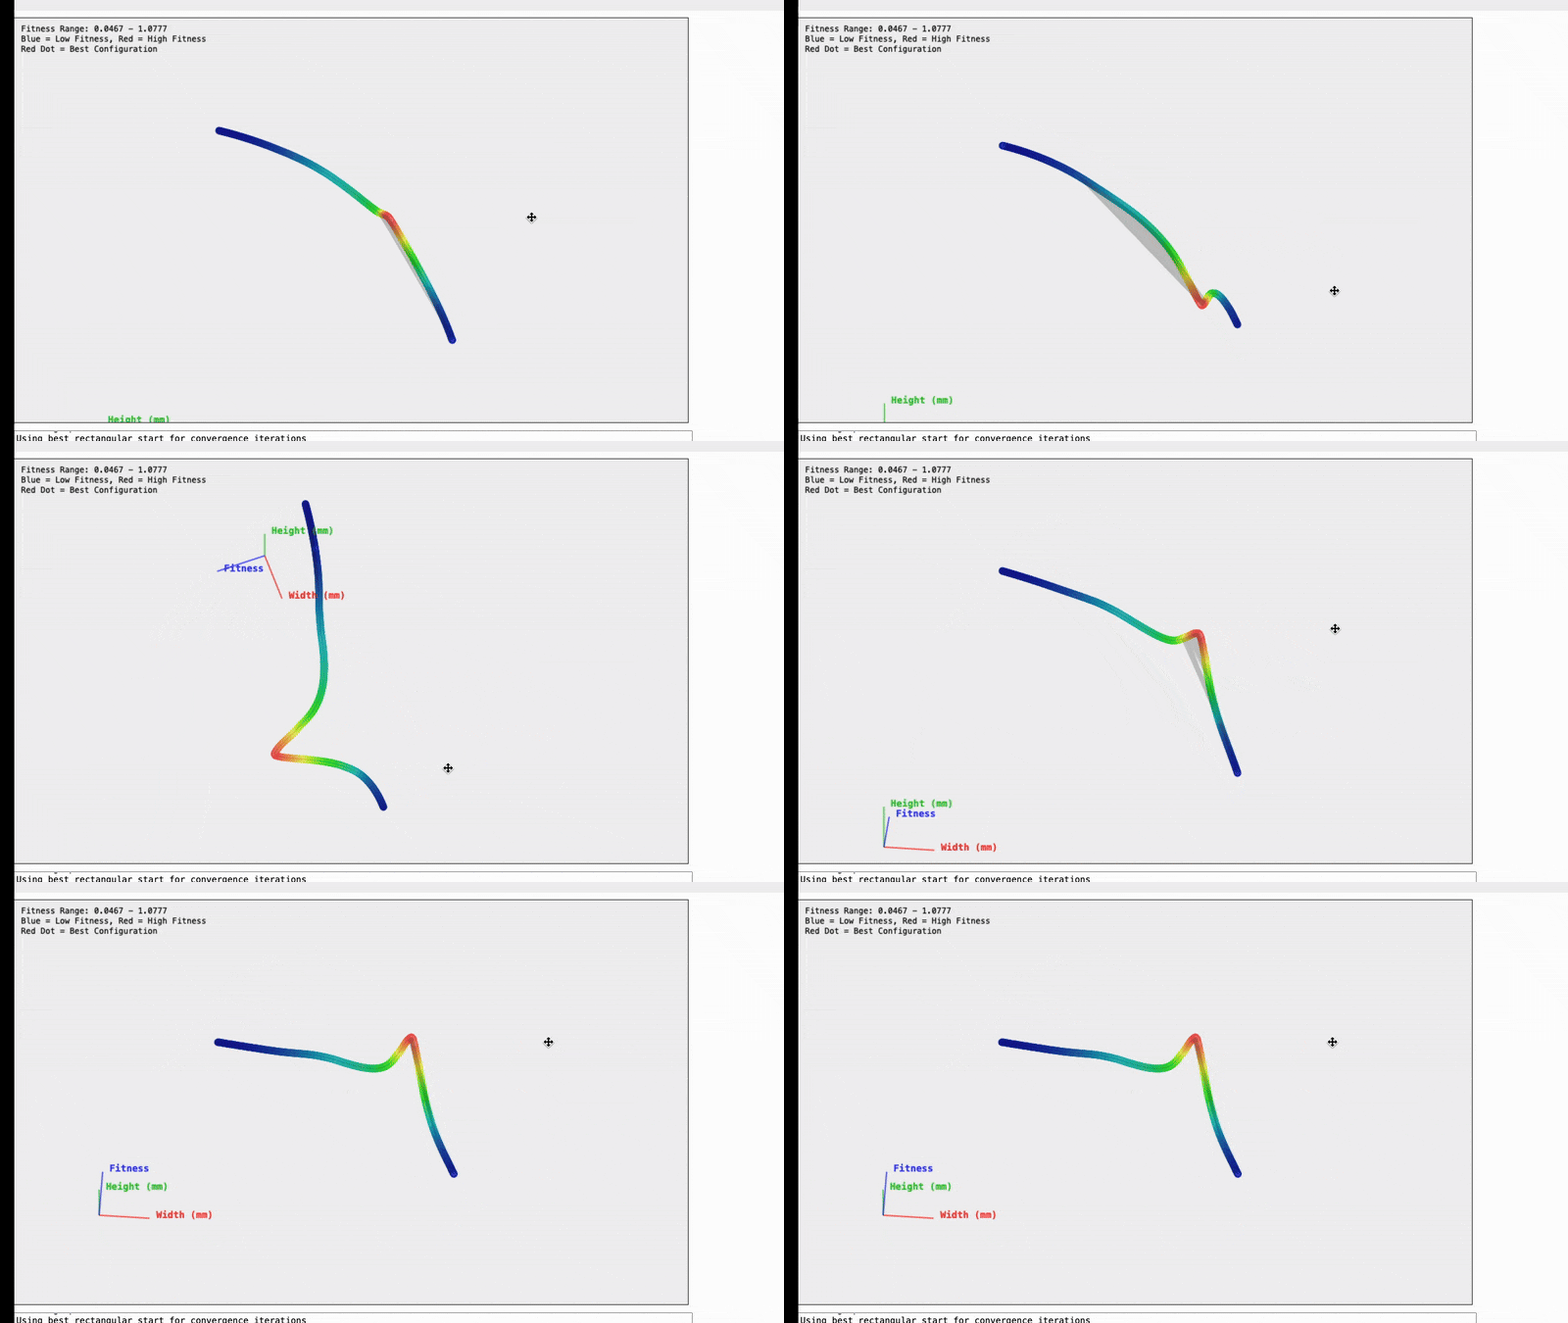
The insight we’re getting here is that all of the possible frames which reasonably match our data seem to fall on an arc centered around 0,0.
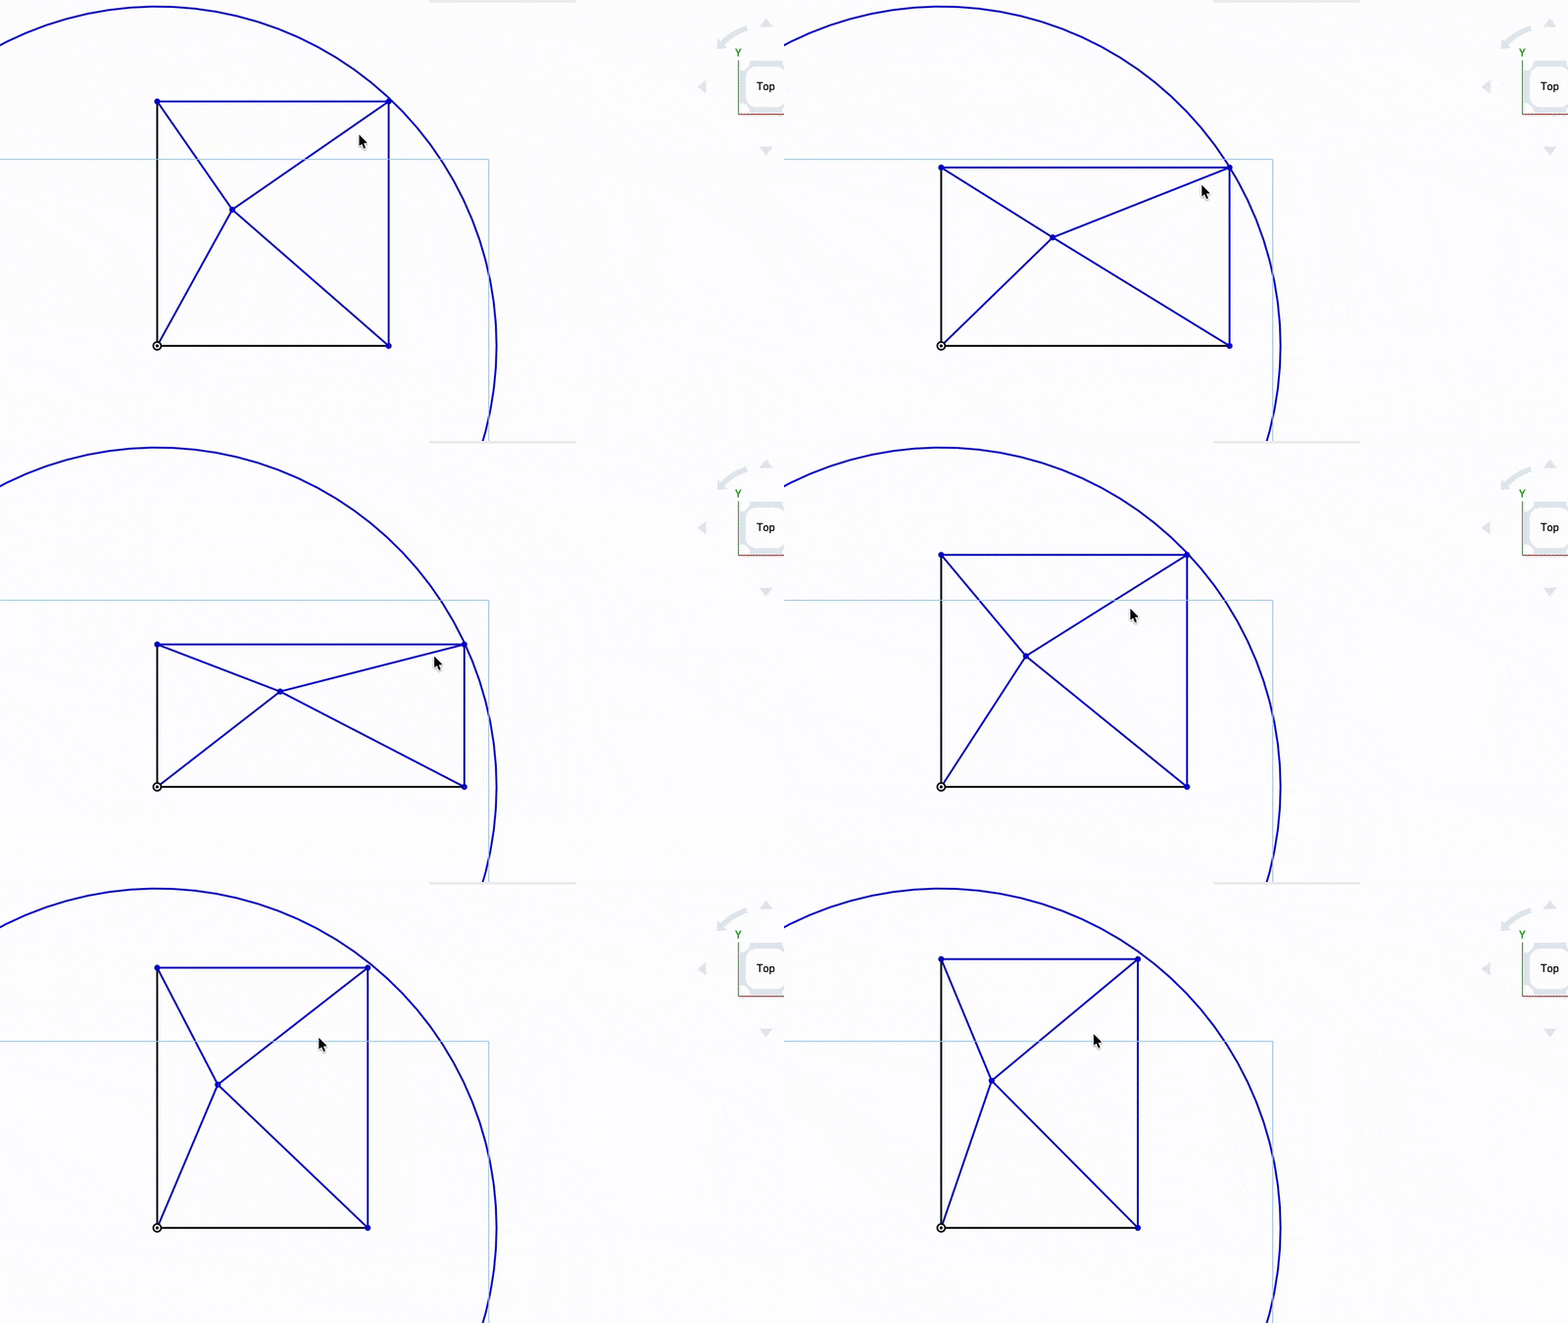
My hunch for why it looks like a circle is that for a single set of measurements all of the possible frame sizes seem to approximate a circle.
That means that instead of having to search a 6 dimensional space we’ve gone down to a three dimensional space by making the assumption that the frame is rectangular, and now that we know the points we care about all fall along an arc we only have to explore a two dimensional space…which is massively easier.
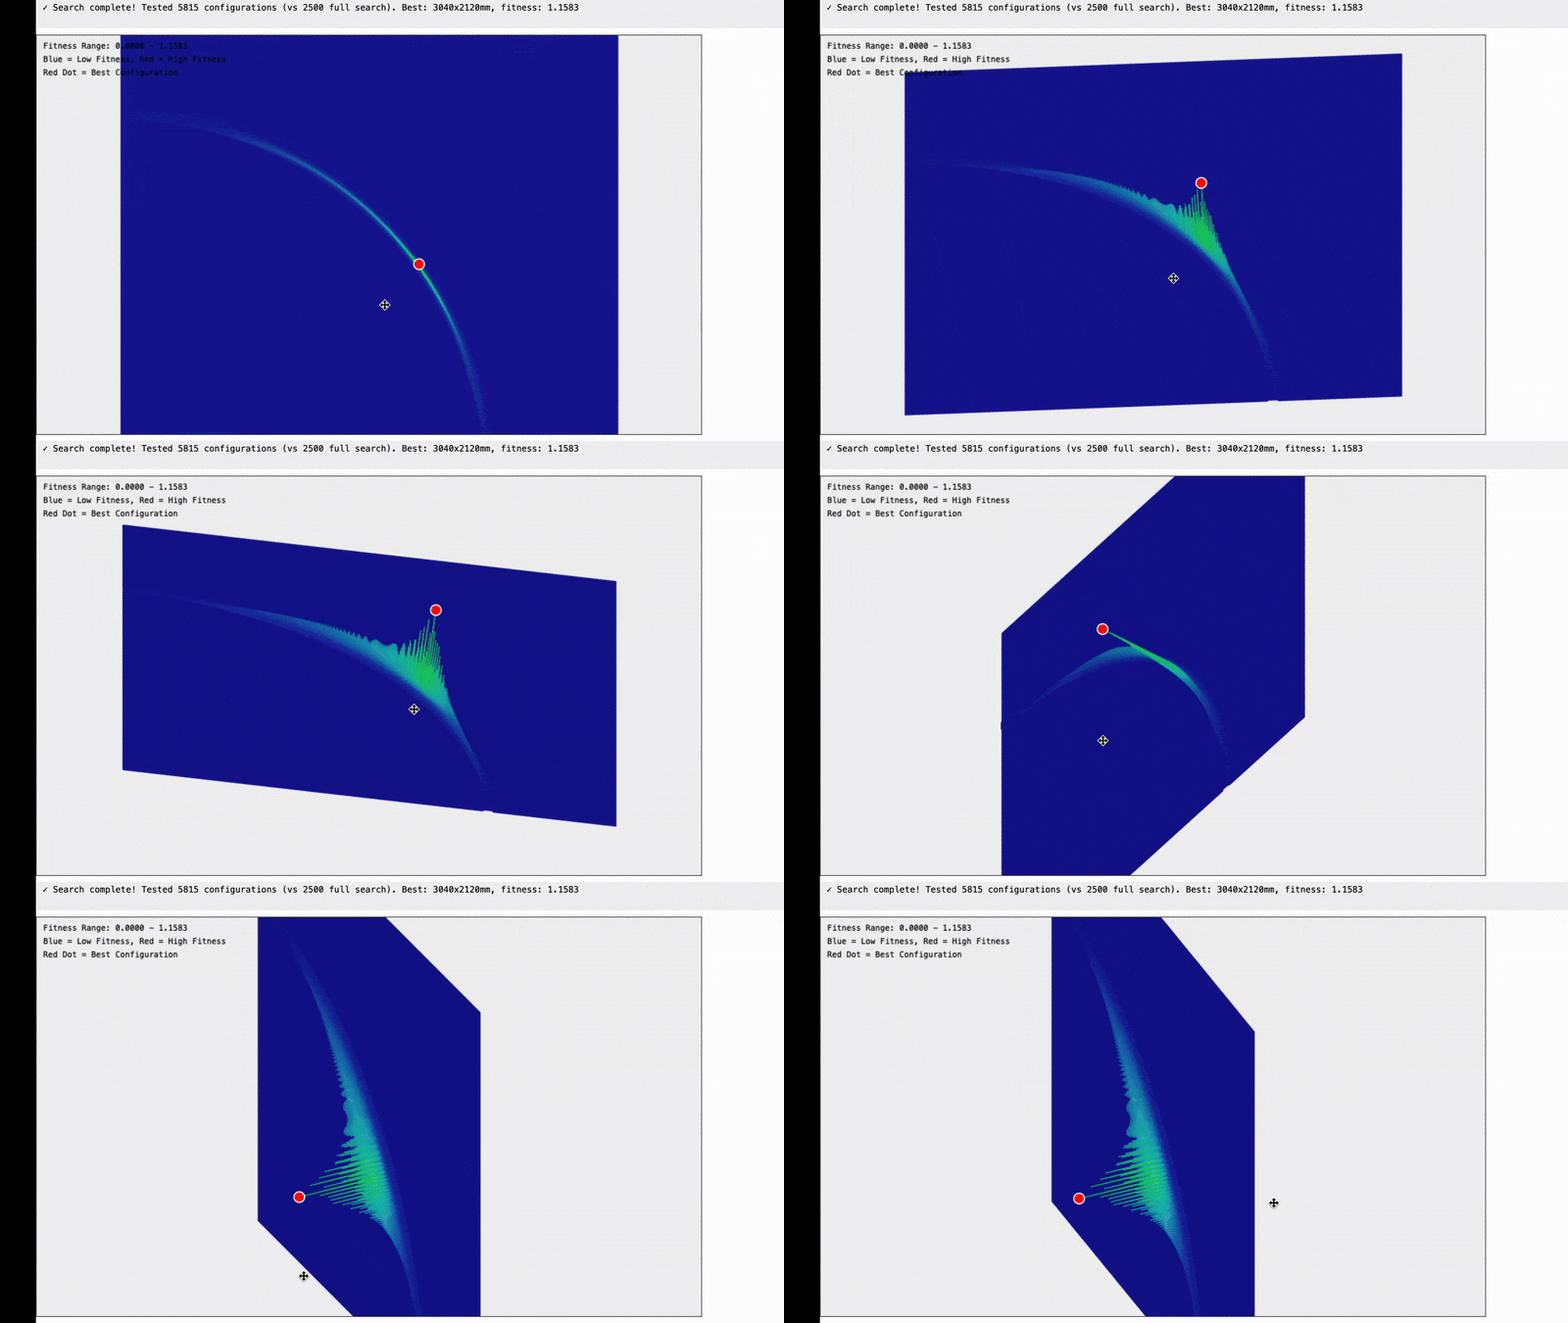
Optimizing the system to handle higher resolutions we can see that there seems to be a clear peak which is the point that we are looking for although the data is quite noisy.
Fortunately the noise seems to be coming from quantization (basically we’re using a rectangular grid to sample along the curve so sometimes our sample points land on the curve, and sometimes they land just off to one side or the other).
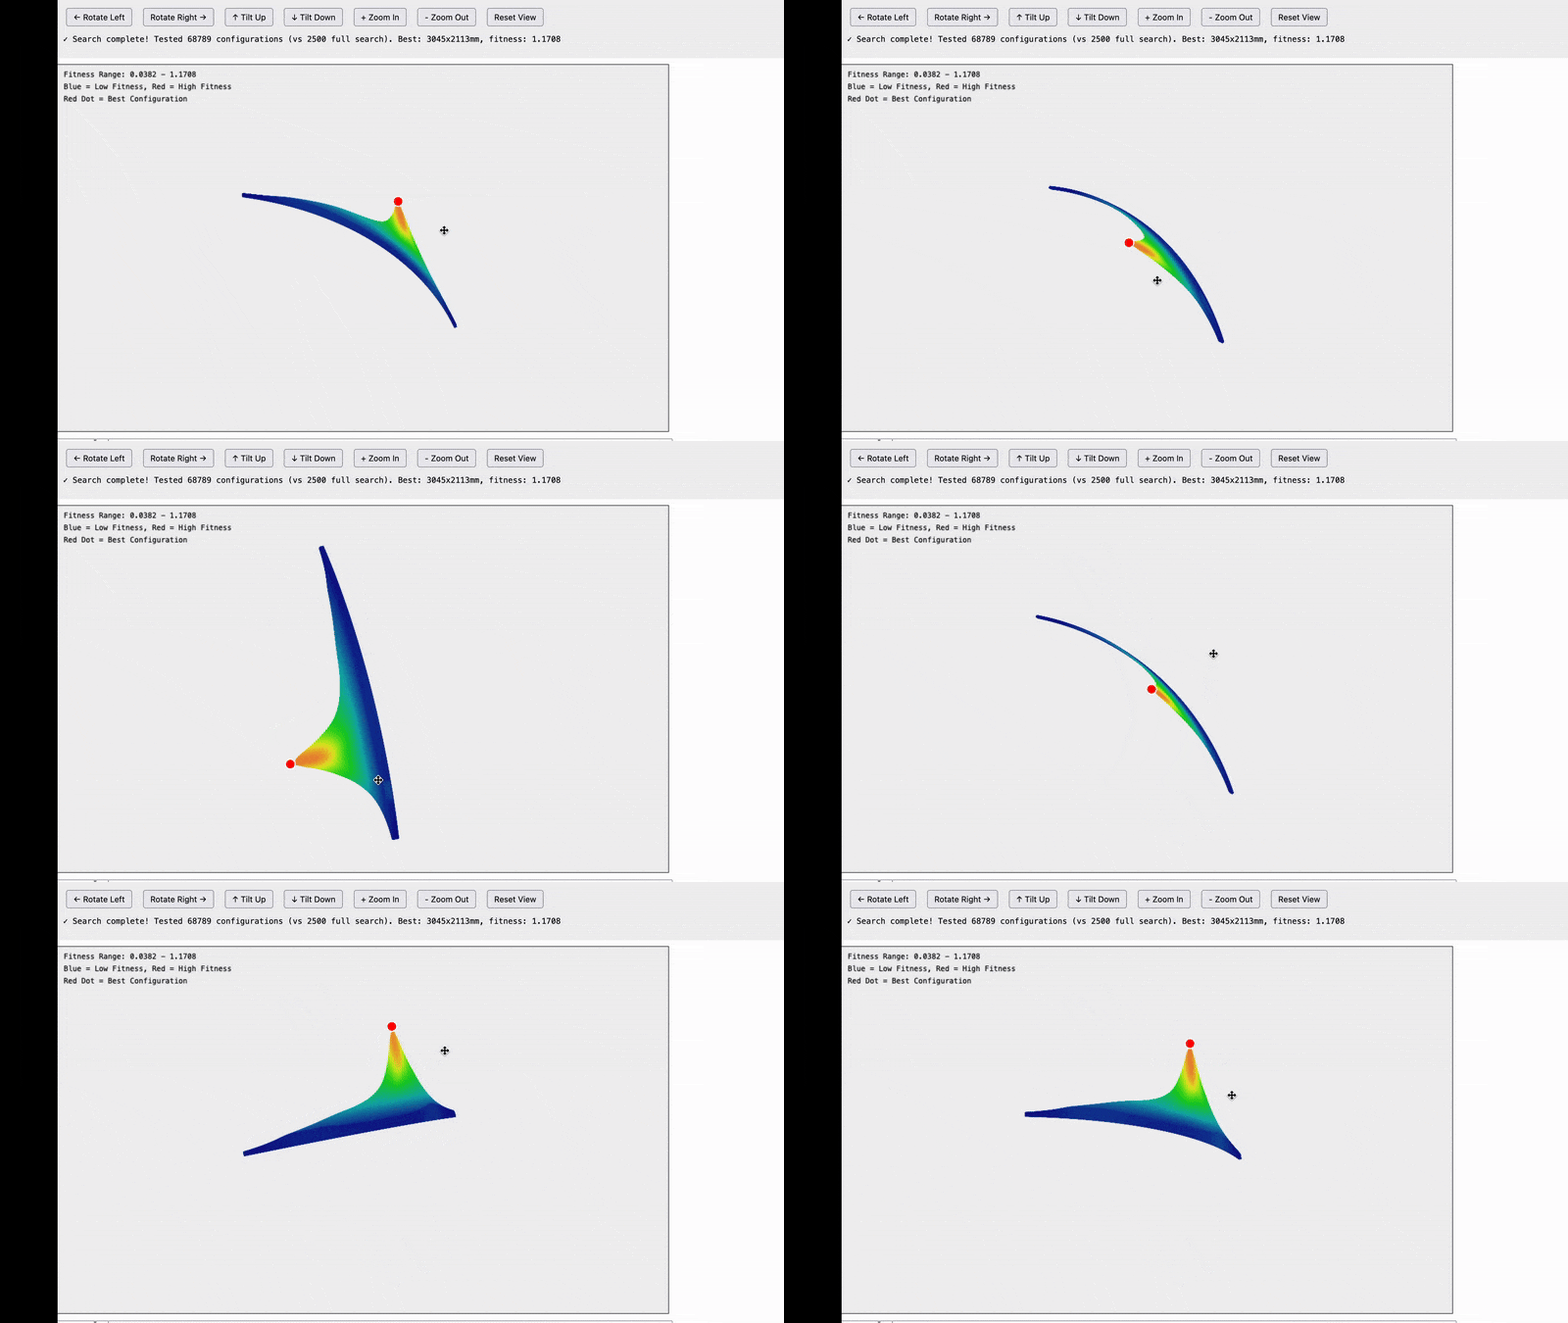
Optimizing further to only compute the points that we care about lets us compute an even higher resolution and we get a very nice smooth curve with a clear peak.
Once we established that we were looking is points along a curve, there is really no reason to sample on a grid at all. Instead we can sample directly on the curve which looks like this:
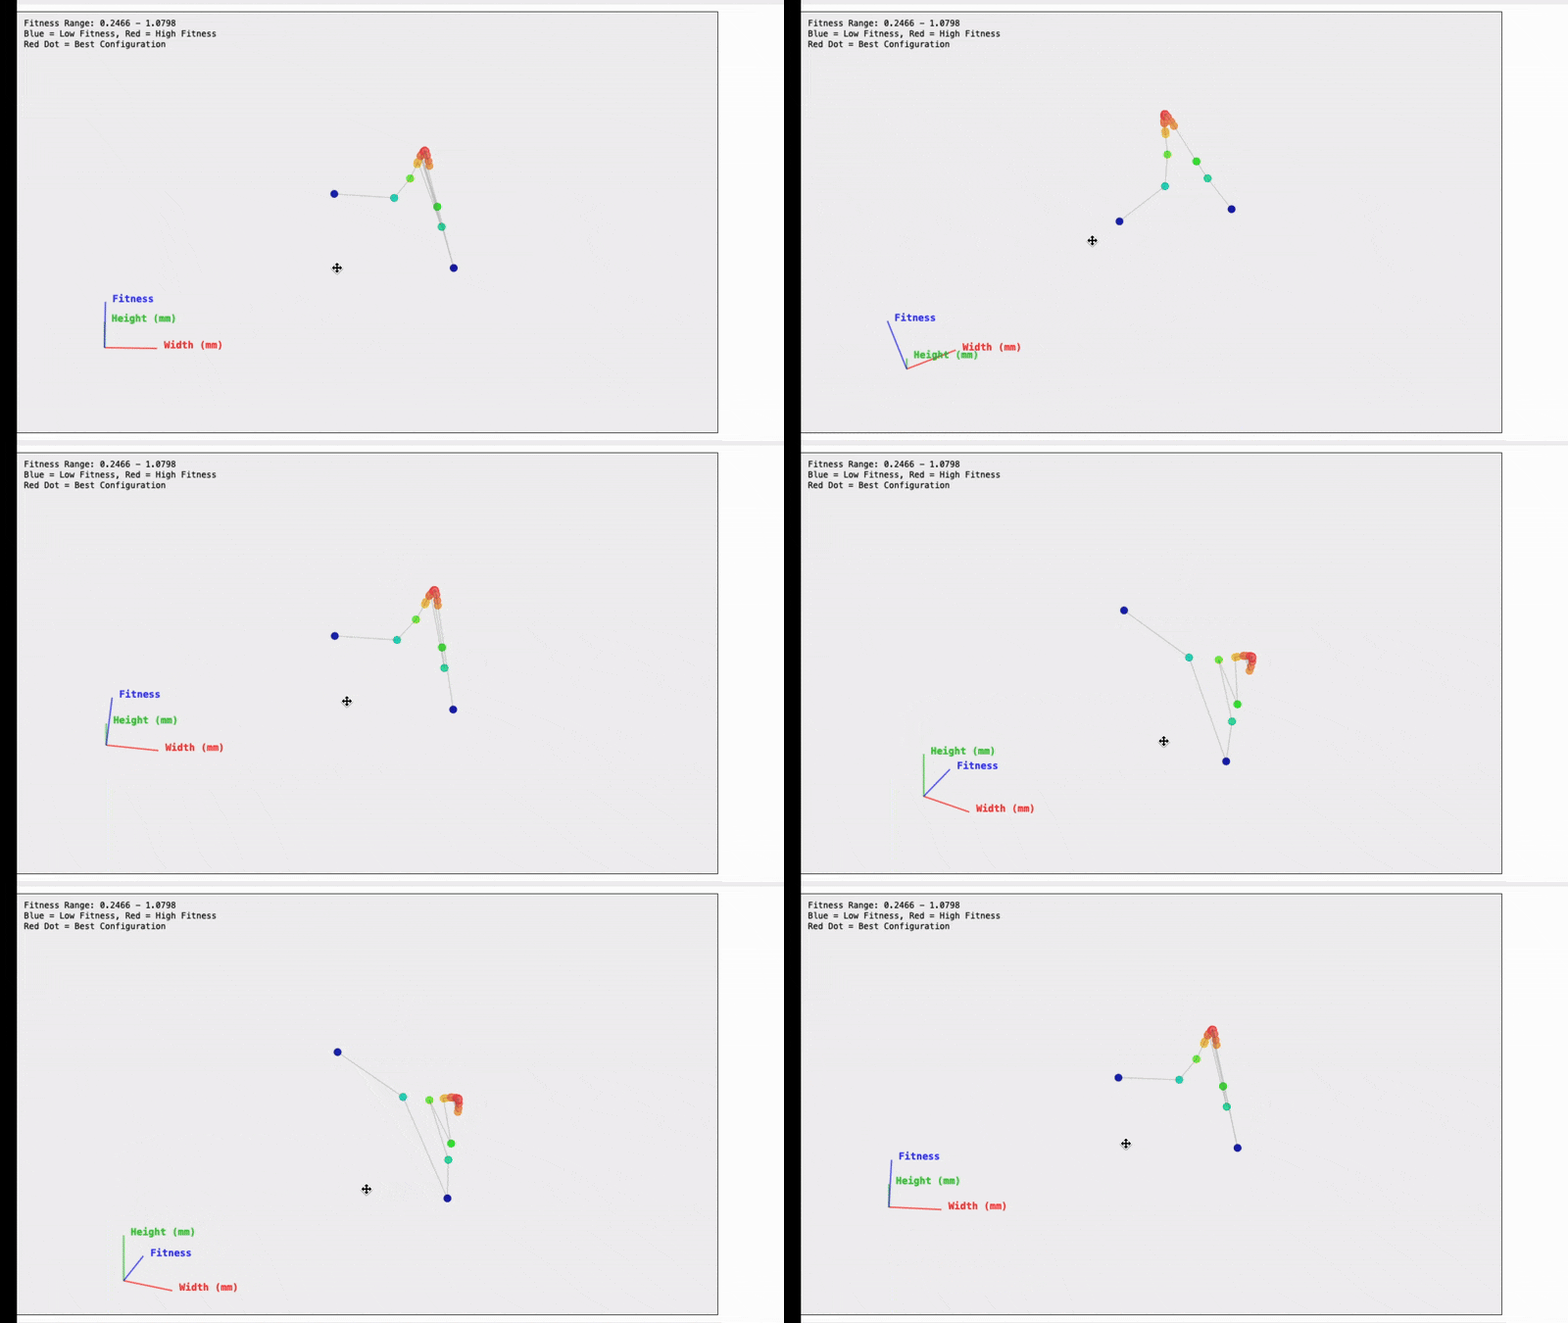
And finally to optimize things even further, we don’t really care about finding every point along the curve, we just care about finding the peak so we can use an intelligent sampling system to sample points on either side of the peak to close in on it while doing the least calculations possible.
The result is an algorithm which takes in very limited data (just six measurements) and in milliseconds can give us a good estimate of the frame size which will hopefully give our larger and more complex algorithm a better starting point.
The next step is to integrate this into the machine and test it on hardware.
Thanks for reading all the way to the end, and for those of you who aren’t interested in math I will do my best to get back to making physical things ASAP.
Have a great week everyone!
-Bar

